Home Seven Tips for Visual Search at Scale
Author: Pat Lasserre
Visual search is a rapidly emerging trend that is ideal for retail segments, such as fashion and home design, because they are largely driven by visual content, and style is often difficult to describe using text search alone. It is a topic of interest to data scientists, as evidenced by the full room at a recent visual search panel session at ODSC West 2018. The panel was moderated by George Williams from GSI Technology, and it featured presentations from Clarifai, eBay, Google, Walmart Labs/Jet.com, and Wayfair.
The remainder of this post summarizes eBay’s panel presentation and was written by Fan Yang, Qiaosong Wang, Hadi Kiapour, and Robinson Piramuthu from eBay Inc. It provides key tips for building a large-scale visual search system. Their source post can also be found on eBay’s website.
We had the pleasure of being part of the panel session on visual search at ODSC West 2018 on Nov. 2, 2018. In this article, we summarize our presentation, which was based on our paper “Visual Search at eBay,” presented at KDD 2017.
Imagine that you are in a store that looks like a large warehouse, with numerous aisles that are identified by a unique positive integer. eBay has over 1B live listings at any given time. So, if eBay were such a store, it could very much look like the infinite stockroom in the 1999 movie Matrix. You have a page from a printed catalog of plumbing parts and are on a quest to find one of them for which you do not have a model number. You seek a store assistant and point at the plumbing part on the page. The assistant directs you to few aisles, say aisles 183, 5276, 14098. Without this information, you would have to walk through every single aisle and compare the picture of the plumbing part with each item on the aisle.
This comparison task gets very complex if parts look very similar. In this case, you would pay attention to every single detail such as color, shape, size, brand, packaging, etc. If the aisles were organized by the type of items, you would sample a few from each aisle and then spend more time at relevant aisles. This is a very complex task, where if you miss the item of interest, you may never find it in a single pass through all the aisles. Algorithmic search essentially simplifies this process when it comes to large scale search.
As mentioned in our KDD paper, we train a neural network to predict leaf category from a given image (see Figure 1). These leaf categories are much like the different aisles in our “warehouse.” This neural network-based classifier acts like our store assistant who identifies the potential aisles. We use a top few potential leaf categories selected based on probabilities predicted by the softmax layer in our neural network.
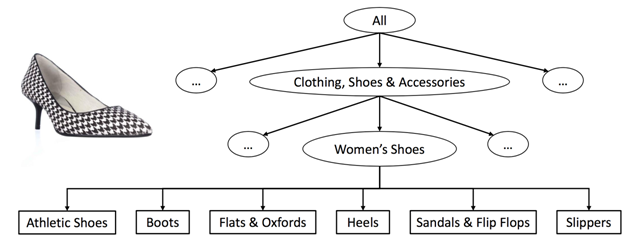
Figure 1: Listings are organized by a hierarchy of categories where the terminal entries are called “leaf categories.”
These labels can be used to train a deep neural network to predict leaf category, given an image.
Once we are at an aisle, we need to know how to compare two images (the query and an item on the shelf). We represent each image by a compact signature in the form of a series of numbers represented as a vector. This signature is also extracted by the same neural network using weak supervision. We extract a binary vector (made up of 1’s and 0’s) by training the network with a sigmoid layer to predict top leaf categories. It is best to use as much supervision as possible at all steps. Since we have a lot of diverse data for a leaf category, we train the network to predict the leaf category. You can look at “Exploring the Limits of Weakly Supervised Pretraining,” ECCV 2018 to appreciate the power of pretraining a large network and then transferring it to a different task. This weak supervision along with data augmentation (such as crop, flip, rotation) during training helps the network to discount the background and focus more on the important parts of the object that matter, giving rise to a compact semantic signature. These signatures can be easily compared. In the case of binary signature, as in our paper, we can count the number of matched bits based on Hamming distance. Matched items from the selected leaf categories can be ranked based on this similarity. The more matched bits the better.
Key challenges we face in large scale visual search for commerce include
● Variation in image quality and composition
● Large inventory to compare
● Inventory is heavily fine-grained
● Need simple architecture and models for easy maintainability
In the following, we summarize tips to build a large-scale visual search system. A lot of these tips could be applicable to non-visual or multimodal systems.
1. Understand the data, and use stratified sampling
Data is principal in determining the strategy for the entire procedure. The quality of image can introduce complexities and needs to handled carefully. It is important to understand both the images in the inventory as well as the images typically uploaded by users during visual search. Figure 2 depicts a visualization of a subset of the eBay handbag inventory. It has a mix of complexities based on background as well as attributes of the handbag. Figure 3 highlights another situation where the same object can be captured so many different ways when it comes to camera pose. It is critical to use a diverse and representative set of images when we train our neural network so that these situations can be handled by the neural network.

Figure 2: Visualization of images of handbags on eBay using t-SNE. Notice that about 40% of the images have a difficult background,
slightly over 10% have a white background. User-uploaded images have even more variations, such as rotation.
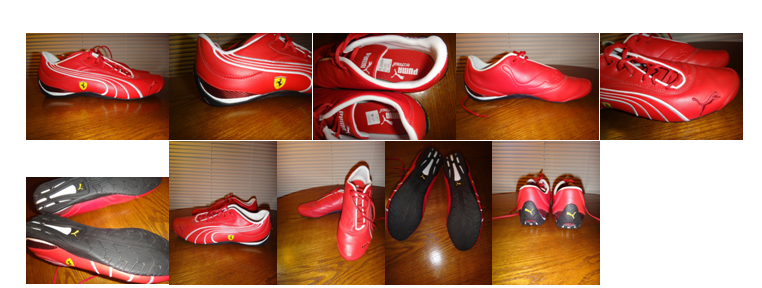
Figure 3: An eBay item titled “Ferrari Puma~Red Leather Sport Shoes Sneakers~Men’s Size 8,5 (Women’s Size 10).” Same item, very different pictures!
The size of the training set is determined by factors such as the number of labels we want to predict, the diversity of data within each label, memory and compute constraints imposed by the training infrastructure, and the time budget to train such a system. When we create the training set for our neural network, we use a stratified sampling over leaf category, sellers, condition, brands, etc., and finally remove duplicates, in order to make sure we capture the richness in diversity of data.
2. Data augmentation is critical, specifically rotation
Data augmentation is a critical step in training neural networks when the training data does not capture all variations that are likely to happen in real use case. When a user takes a picture of an object using a mobile phone, it is very likely that the object is not properly zoomed in/out, is cropped out, is rotated, is blurred, etc. Data augmentation (Figure 4) produces variations in data synthetically, especially when these variations are more likely to happen, but are not present in the training set based on eBay listings. It is not very likely that the object is rotated much in eBay listings. However, it is normal in user uploaded images. So, we observed that rotation is an important operation in data augmentation. Rotation is often ignored in data augmentation but is important for visual search.
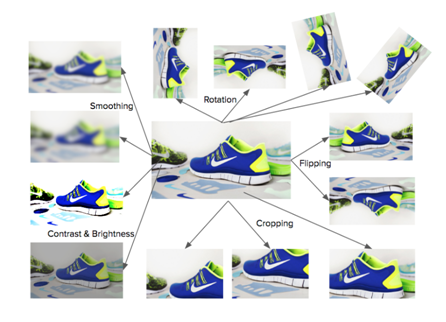
Figure 4: Data augmentation allows us to synthetically create more variations from a single sample. Here is a selected few data augmentation operations.
Rotation is often ignored, but is very important.
3. Extract the semantic signature with as much supervision as possible
As mentioned in the introductory text, it is very important to use as much supervision as possible. This helps in training the classifier to focus on informational content and discount other non-informational regions. It is best to leverage large, diverse data with low acquisition cost for strong supervision (such as leaf category prediction) when labels are not available for the actual task (measure similarity between pairs of images).
4. Analyze the entropy of signature
This step is usually ignored in many system designs for large information retrieval systems. It is critical to assess if we effectively pack information within a given capacity of signature. For example, if we use 8 bits to represent the binary signature, we could represent up to 2⁸ unique concepts. In the optimal case, each bit takes the value of 1 with a frequency of 50%. We could calculate the entropy of the system to get the effective bit length and compare with the actual bit length. It is good to allow some slack to account for redundancy in the system, in case some bits are affected by noise and perturbations (Figure 5).
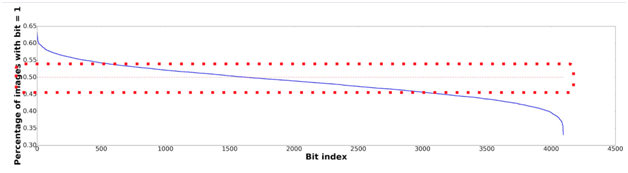
Figure 5: Optimal bit occupancy is vital for optimal information representation. This picture is from our paper and corresponds to ImageNet. 84.1% of bits are active (=1) on 45% to 55% of data.
It is good to have some redundancy in the system so that it is not exactly 50% for all bits.
5. Within-class variance is important when labels are coarse
We use coarse leaf category labels instead of product IDs to train the neural network. This is partly because leaf categories, although coarse, are more readily available. Several items in categories such as clothing and furniture do not have product IDs. Typical classification systems aim for minimal within-class variance. The ideal case is when variance is 0. Here, all samples from a class collapse to a single point (see Figure 6).
For example, all samples from athletic shoes will be collapsed to a single point. But, there are numerous unique products that fall under the leaf category “athletic shoes,” and we want to be able to find them using signature similarity. So, we claim that when labels are coarse and fine-grained search is desired, between-class variance should be high, but within-class variance should also be high. This can be measured by looking at the entropy of the signature, as discussed in the previous tip.
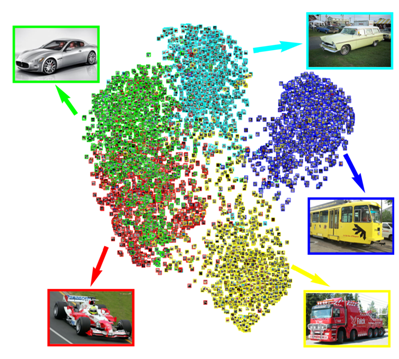
Figure 6: The recommendation for classifiers is to have small within-class variance and large between-class variance. However, we argue for a better fine-grained search, and it is important to have large between-class variance, but also large within-class variance. Fine-grained matching is not possible when the points in each cluster collapse to a single point. This figure shows five classes from ImageNet, where samples from the same class belong to the same type (equivalent to product), plotted using binary signatures. Within-class variance becomes more important for large scale visual search for commerce, where we use coarse class labels (leaf category) and aim for fine-grained search (product).
6. Process of elimination for speed and precision
The process of elimination is very powerful when tailored for high speed and precision. For example, if the input image contains an athletic shoe, there is no point to search inventory for dress, table, computer. We showed in our KDD paper that it is very effective to use a strong classifier to predict the top few potential partitions (leaf categories/aisles) to reduce the search space and also to improve precision (dress signature will not get confused with shoe signature).
7. Absolute vs. cumulative top-k partitions
We use a strong classifier, a deep neural network trained using strong leaf category labels, to predict the top partitions (leaf categories/aisles). When confidence of top prediction is high, there is no need to search other partitions. However, when top prediction is uncertain, it is best to include other competing partitions. So, we recommend to use cumulative top-k for better precision and absolute top-k only for those situations where exact match is desired even at higher cost. See Figure 7 for details.

Figure 7: Assume that we use the top 5 predicted partitions (leaf categories) to narrow down the search space by the process of elimination. We recommend using the top 5 based on cumulative score rather than absolute score. Use absolute score only when precision is not as important as recall, such as in the scenario to find the exact match at any cost. You can find details in the KDD paper. We show three scenarios in this figure with a score threshold of 0.9. A cumulative score uses more categories (as shown by gray cells in a, c) when the confidence is low and uses few categories when confidence is high (as shown by gray cells in b).
We presented seven tips above. In addition, we recommend minimizing humans in the loop (including for evaluation), retrain models periodically to cope up with shift in data distribution, and keep the number of models to a minimum for easy maintainability.
Hopefully, this article gave you some insights into why these tips are important. Please read “Visual Search at eBay”, KDD 2017 for more details.